Fiber polarity matters: the shift to smarter polarity mapping
When connectors or fibers aren’t properly aligned, fiber polarity is interrupted. The transmitted signal misses the intended receiving fiber. For instance, this misalignment can occur when:
- The wrong type of patch cord is used
- A connector is flipped
- A connector is plugged into the wrong port
When these kinds of mistakes happen, the transmit signal can’t connect to the corresponding receive port. This means the signal is not transferred between fiber ends, creating signal degradation and poor network performance.
What drawing tools lack when it comes to fiber polarity
To visualize how signals flow through a fiber system and ensure alignment between transmit and receive fibers, many engineers, designers and installers opt to draw or map fiber polarity.
This practice also documents polarity so it can be referenced during moves, adds and changes or other maintenance or upgrade projects.
For example, when new equipment is added to a rack, fibers need to connect to the patch panel. If there is no polarity map—or if it isn’t referenced—then a technician may accidentally flip a connector, which connects the transmit signal to a transmit port instead of a receive port.
While drawing tools and graphics software can simplify this visualization process and help teams create polarity maps, these tools can also introduce risks. They make it too easy to mistakenly alter or misrepresent the intended configuration of the fiber system and create fiber polarity problems.
Why fiber polarity documentation matters so much right now
Why is it so important to improve the way fiber polarity is drawn? Because, as needs evolve and require new technology, fiber systems are becoming more complex. They must be able to support:
- Data centers that process information for artificial intelligence and machine learning
- 5G networks that demand massive data capacity
- Cloud computing environments that rely on high levels of data traffic
- Edge computing environments that demand low-latency performance
- Virtual and augmented reality platforms that require high speeds and no disruption
- Healthcare technology, like telemedicine, which involves reliable communication
Massive amounts of data flow through these applications, and it needs the ultra-low latency and high reliability that fiber can provide. As more systems, devices and users are added to the network, fiber systems must also be able to scale and accommodate higher fiber counts, which can further complicate network design.
If your team documents fiber configurations using traditional polarity drawing practices, your drawings will become just as complex as your systems. And they’ll be difficult to follow.
Making improvements to fiber polarity mapping
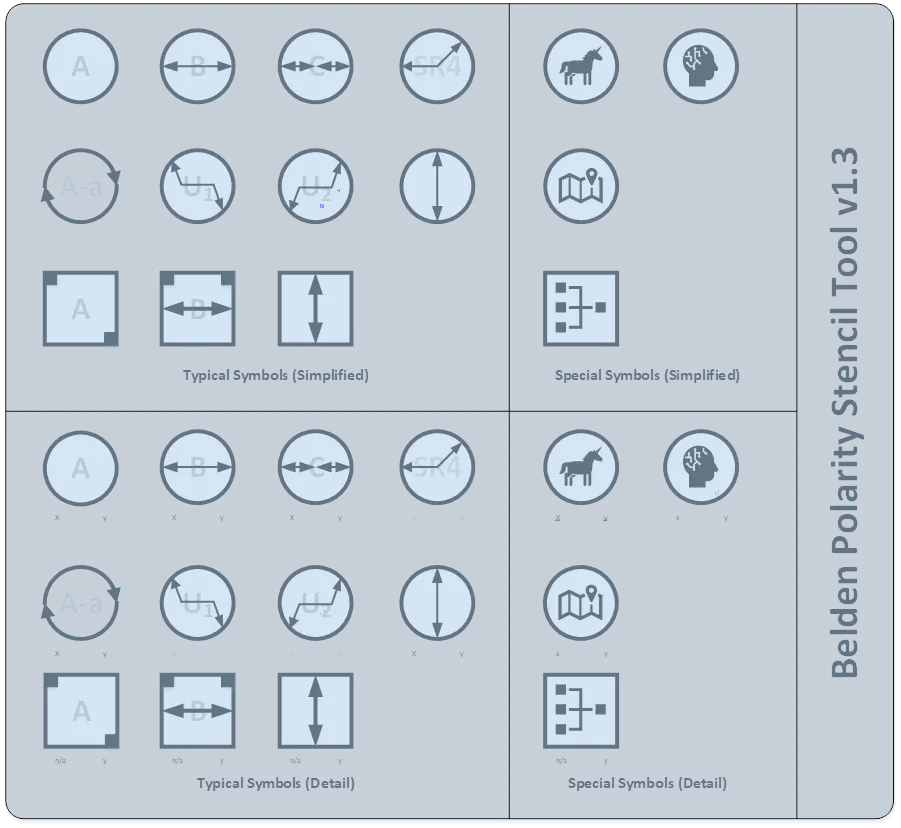
For the past few years, Belden has been working closely with TIA to change how the industry maps fiber polarity. Instead of using drawings, which are difficult to interpret, the emphasis will be on creating visual symbols that visually represent what each component looks like and describe what each component does.
For example:
- Adapter symbols will be represented with a square
- Cable assemblies will be represented with a circle
- Information inside the shape represents what’s happening inside the cable or adapter
This streamlined process can reduce the complexity of polarity mapping, improve accuracy and simplify training by:
- Standardizing symbols for uniformity across documentation and teams
- Representing attributes like strand count, pinning, length, loss profile, part numbers, etc. within each symbol
- Reducing potential misinterpretation and making polarity more visually intuitive and less overwhelming
- Making it fast and easy to replicate and update polarity maps
- Eliminating the need for colors and color codes to identify fibers or maintain polarity
- Doing away with freeform modifications (such as accidentally moving or resizing elements) created by drawing tools or software
Learn more about fiber polarity
If you want to learn more about the importance of fiber polarity and mapping, watch the latest webinar in our fiber polarity series.
We explain these upcoming changes, walk you through the new symbols and describe what these changes mean for fiber projects.
Watch the webinar.
Related links:
- Stop Drawing Fiber Polarity—Start Mapping It with Symbols Instead
- TIA standards updates focus on industrial and fiber applications
- Know Your Fiber Terminology: From Fiber Cable to Basic Polarity
About the Author

With an emphasis on data center design, planning and building, Henry Franc acts as a trusted advisor for large or complex projects across all verticals assessing clients’ business needs and finding the best technology options to meet them. He was also elected by industry colleagues to serve as vice-chair of the TR42 Telecommunications Cabling Systems Engineering Committee.